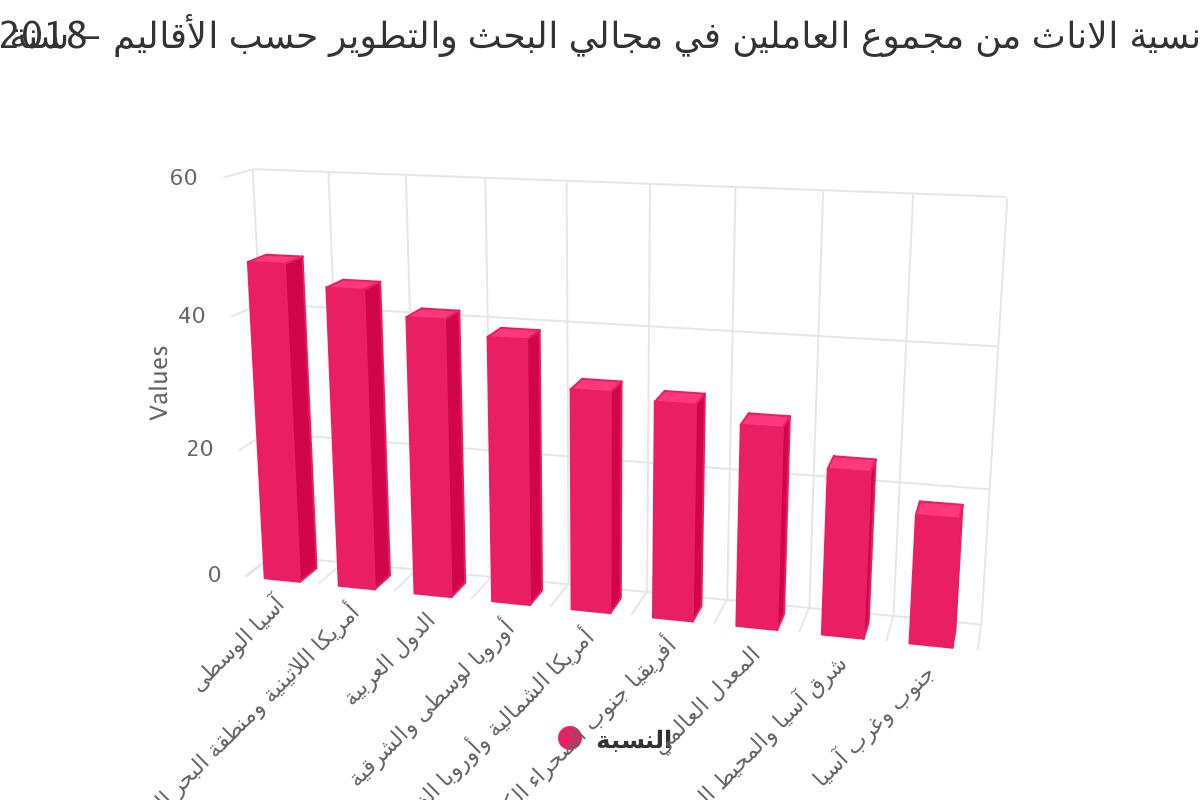
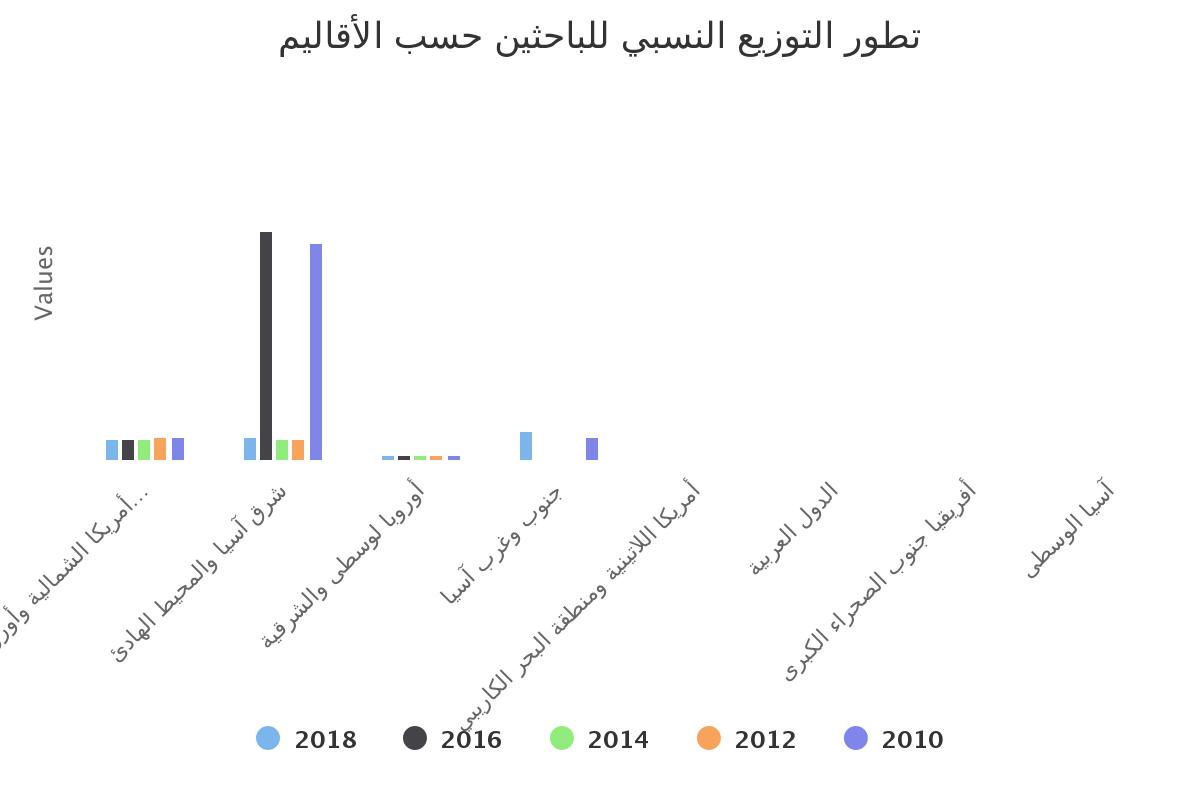
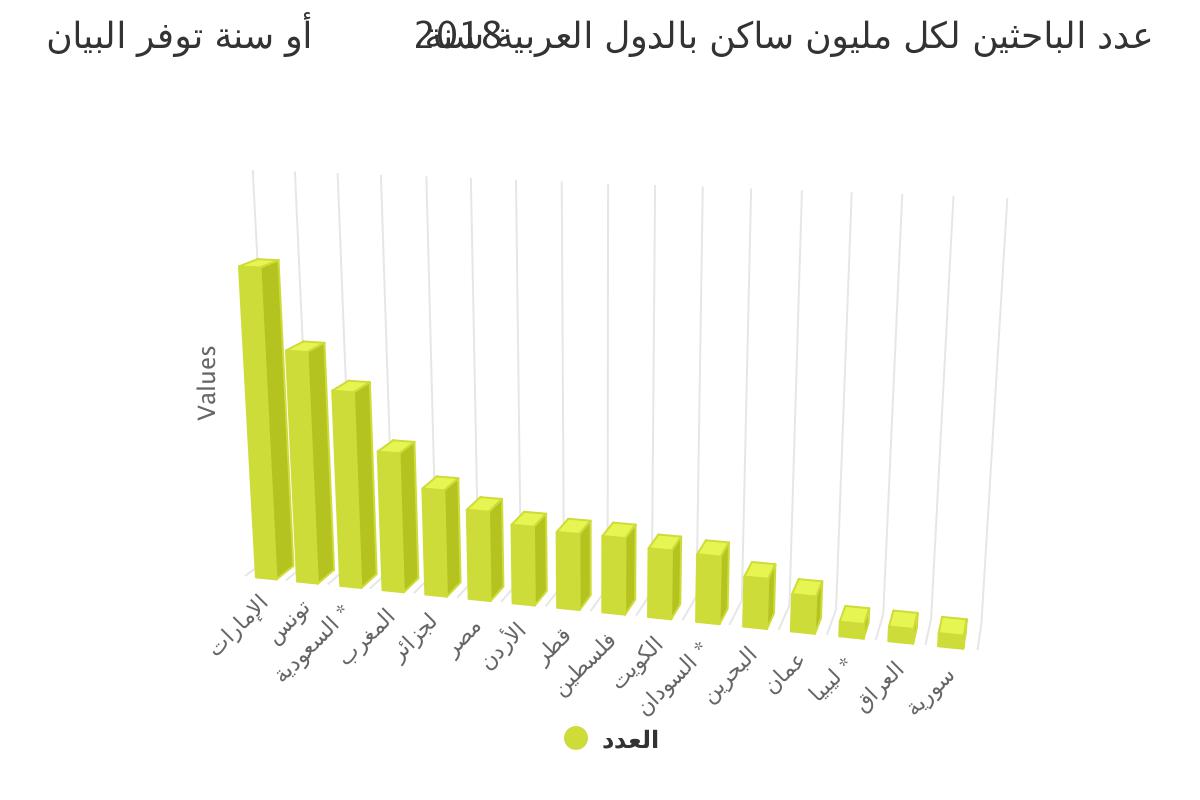
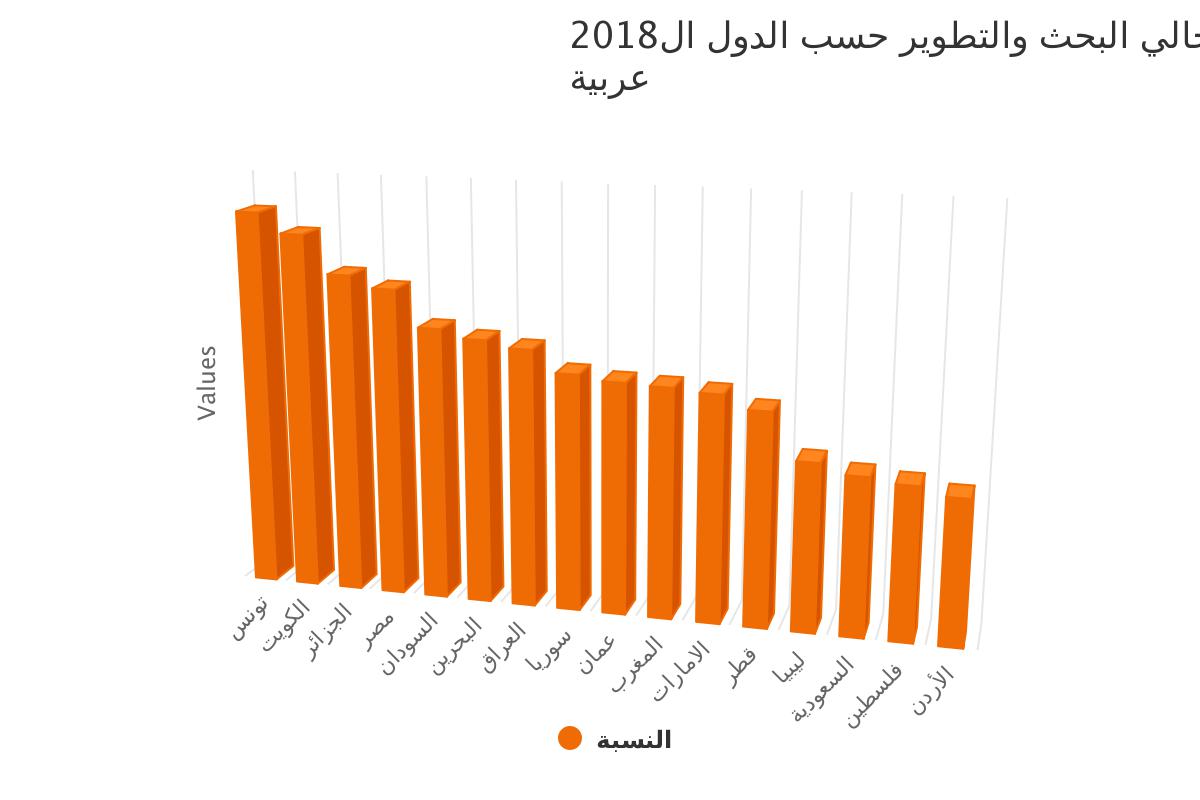
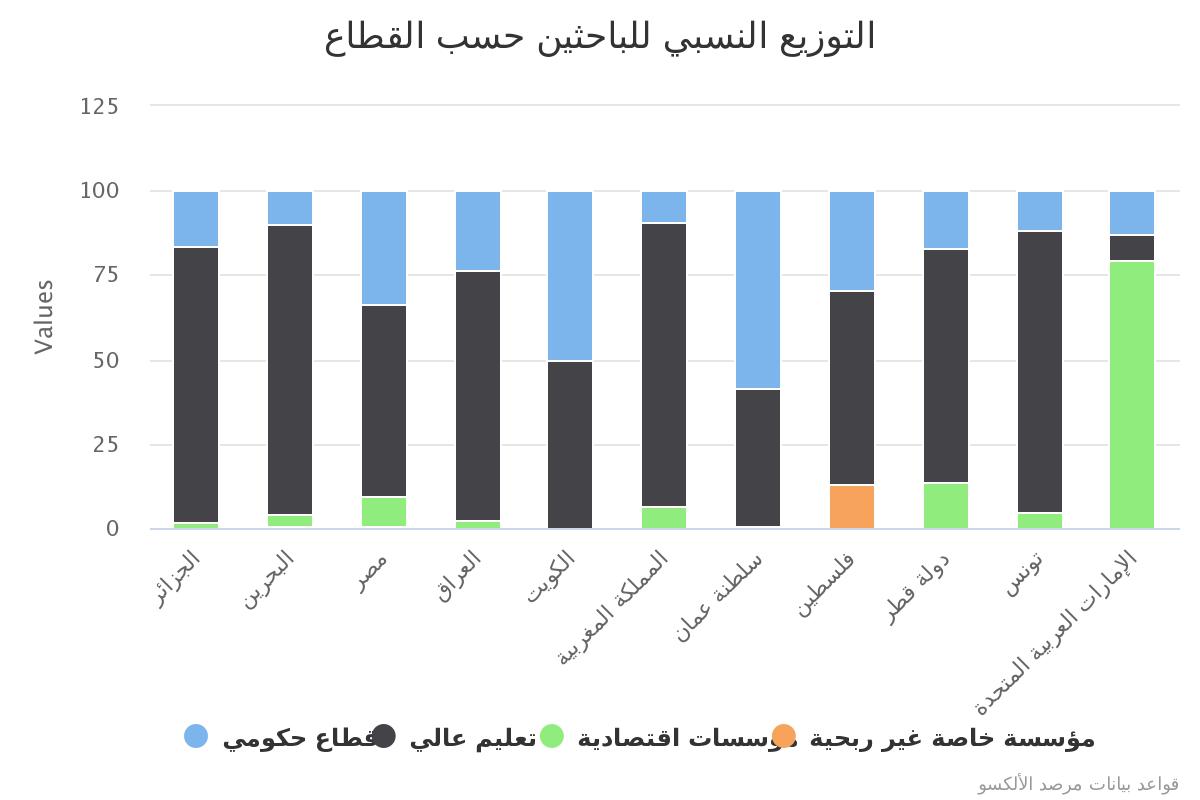
number of researchers per million inhabitants by region
| Year / Territories | 2013 | 2014 | 2015 | 2016 | 2017 | 2018* | 2019* | |
|---|---|---|---|---|---|---|---|---|
| wdt_ID | Year / Territories | 2013 | 2014 | 2015 | 2016 | 2017 | 2018* | 2019* |
| 1 | North America and Western Europe | 4.022,8 | 4.095,6 | 4.205,2 | 4.231,5 | 4.313,7 | 4.389,1 | 4.460,9 |
| 2 | Central and Eastern Europe | 2.059,3 | 2.077,5 | 2.108,2 | 2.090,9 | 2.144,1 | 2.150,9 | 2.169,1 |
| 3 | East Asia and the Pacific | 1.349,6 | 1.388,8 | 1.419,9 | 1.463,3 | 1.501,7 | 1.538,3 | 1.576,1 |
| 4 | global average | 1.105,0 | 1.130,2 | 1.154,3 | 1.173,6 | 1.198,0 | 1.221,0 | 1.243,9 |
| 5 | Arabic average | 478,3 | 532,9 | 544,8 | 572,6 | 579,4 | 614,2 | 638,4 |
| 6 | Middle Asia | 589,1 | 601,5 | 602,8 | 579,2 | 558,9 | 561,5 | 553,2 |
| 7 | Latin America and the Caribbean | 479,7 | 498,6 | 504,8 | 521,4 | 515,4 | 532,2 | 541,7 |
| 8 | South and West Asia | 190,8 | 209,2 | 227,9 | 254,0 | 280,2 | 299,5 | 321,8 |
| 9 | Sub-Saharan Africa | 87,0 | 88,7 | 93,0 | 95,2 | 97,9 | 100,8 | 103,7 |
| 10 |
| Source: UNESCO Institute for Statistics
ALECSO Observatory estimates (*) |

