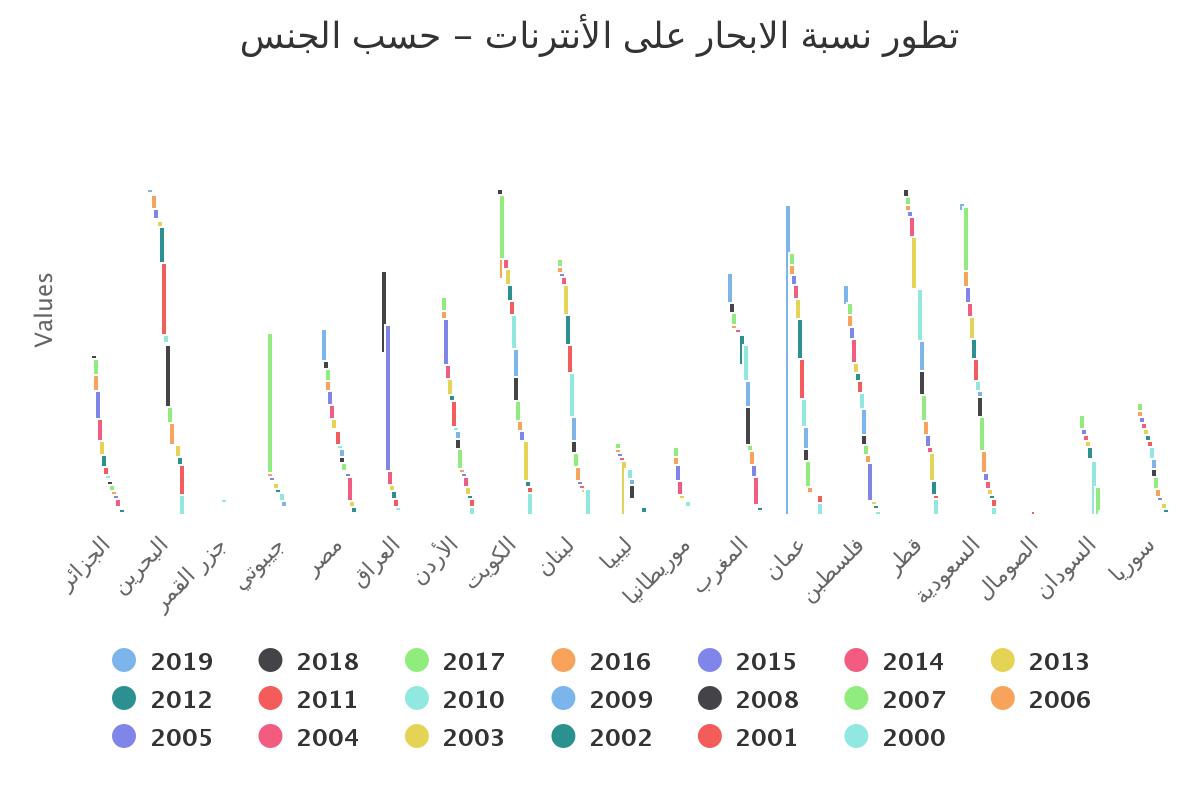
The evolution of the percentage of fixed phone ownership per 100 inhabitants in the Arab countries
The evolution of the percentage of fixed phone ownership per 100 inhabitants in the Arab countries
| country/year | 2014 | 2015 | 2016 | 2017 | 2018 | 2019 | |
|---|---|---|---|---|---|---|---|
| wdt_ID | country/year | 2014 | 2015 | 2016 | 2017 | 2018 | 2019 |
| 1 | Algeria | 8 | 8 | 8 | 10 | 10 | 11 |
| 2 | Bahrain | 21 | 20 | 20 | 19 | 18 | 17 |
| 3 | Comoros | 3 | 2 | 2 | 2 | 1 | 1 |
| 4 | Djibouti | 2 | 3 | 3 | 4 | 4 | 4 |
| 5 | Egypt | 7 | 7 | 6 | 7 | 8 | 9 |
| 6 | Iraq | 6 | 6 | 6 | 9 | 7 | 7 |
| 7 | Jordan | 4 | 4 | 4 | 4 | 4 | 4 |
| 8 | Kuwait | 13 | 13 | 13 | 13 | 12 | 14 |
| 9 | Lebanon | 15 | 16 | 27 | 13 | 13 | 13 |
| 10 | Libya | 14 | 17 | 21 | 24 | 0 | 0 |
| 11 | Mauritania | 1 | 1 | 1 | 1 | 1 | 1 |
| 12 | Morocco | 7 | 6 | 6 | 6 | 6 | 6 |
| 13 | Oman | 9 | 10 | 9 | 11 | 12 | 13 |
| 14 | Palestine | 9 | 9 | 9 | 10 | 10 | 9 |
| 15 | Qatar | 17 | 18 | 18 | 17 | 16 | 16 |
| 16 | Saudi | 0 | 12 | 13 | 14 | 16 | 16 |
| 17 | Somalia | 0 | 0 | 0 | 0 | 1 | 0 |
| 18 | Sudan | 1 | 0 | 0 | 0 | 0 | 0 |
| 19 | Syria | 19 | 20 | 20 | 16 | 16 | 17 |
| 20 | Tunisia | 9 | 8 | 9 | 10 | 11 | 12 |
| 21 | UAE | 23 | 24 | 24 | 24 | 24 | 24 |
| 22 | Yemen | 5 | 4 | 4 | 4 | 0 | 0 |
Source: International Telecommunication Union


