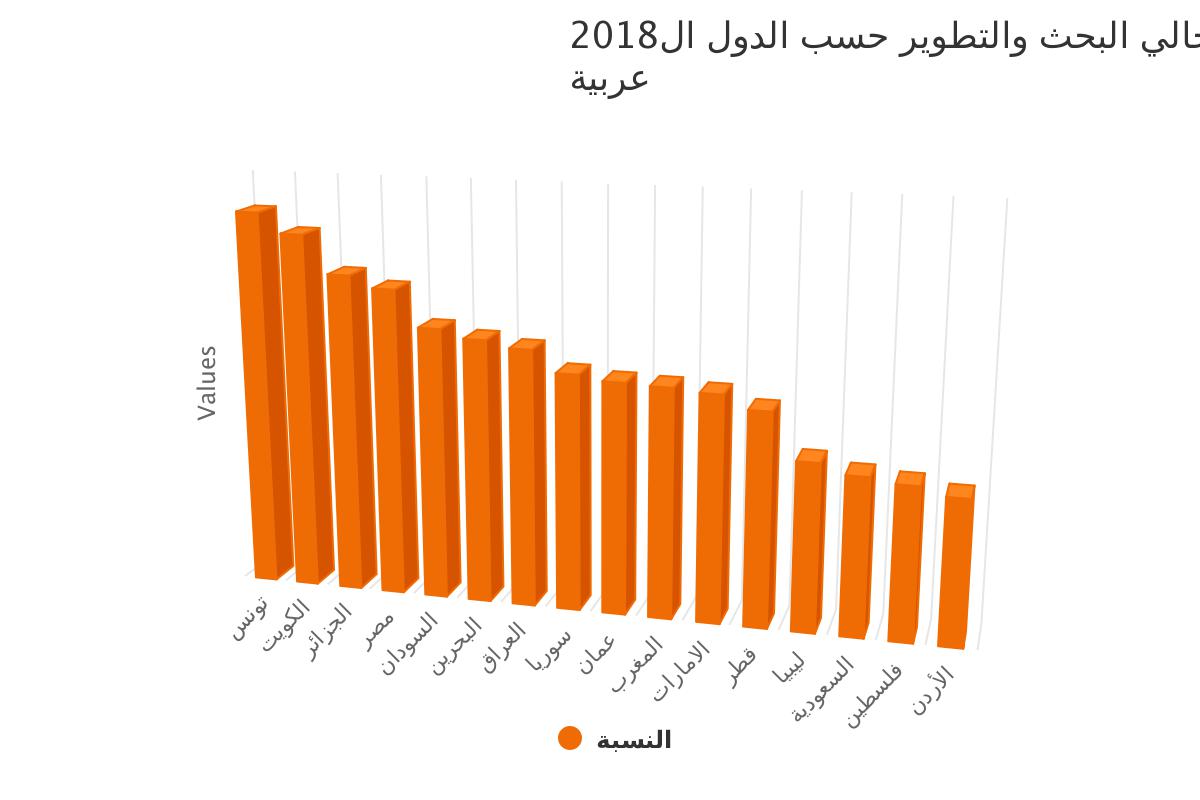
The relative distribution of researchers by region
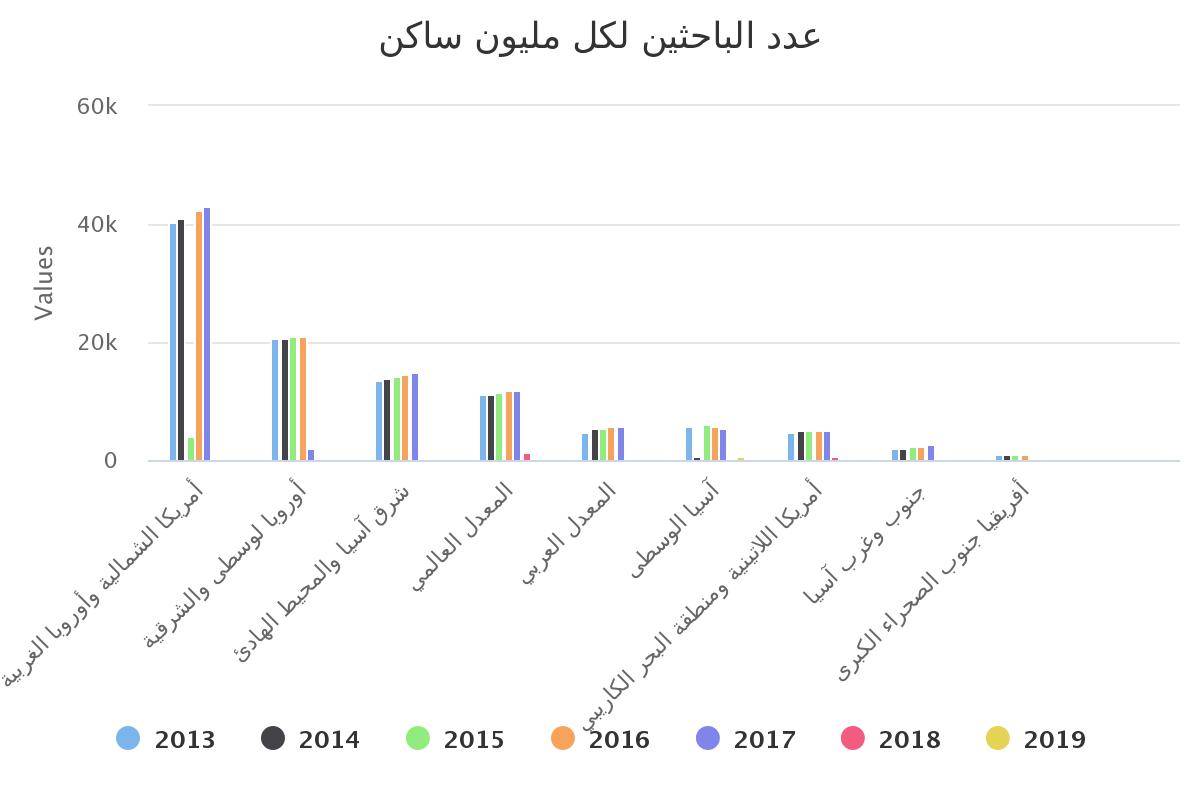
| Territories/year | 2010 | 2012 | 2014 | 2016 | 2018 | |
|---|---|---|---|---|---|---|
| wdt_ID | Territories/year | 2010 | 2012 | 2014 | 2016 | 2018 |
| 1 | North America and Western Europe | 40,7 | 40 | 38,9 | 38,7 | 37,8 |
| 2 | East Asia and the Pacific | 37,0 | 38 | 38,6 | 39,0 | 39,8 |
| 3 | Central and Eastern Europe | 11,2 | 11 | 10,2 | 9,7 | 9,2 |
| 4 | South and West Asia | 4,0 | 4 | 4,5 | 4,7 | 5,0 |
| 5 | Latin America and the Caribbean | 3,6 | 4 | 3,7 | 3,7 | 3,8 |
| 6 | Arab countries | 1,9 | 2 | 2,4 | 2,6 | 2,8 |
| 7 | Sub-Saharan Africa | 1,0 | 1 | 1,0 | 1,0 | 1,0 |
| 8 | Middle Asia | 0,6 | 1 | 0,6 | 0,6 | 0,6 |
| Source: UNESCO Institute for Statistics | ||
| (*) ALECSO Observatory estimates |

